
Last updated: April 28th 2025
The average UK house price has risen from £1,884 in 1953 to a staggering £270,867 in the 1st quarter of 2025. Using data from Nationwide Building Society, we take a comprehensive look at UK house prices over the years including a look at prices in 'today’s money'.
Average house prices over time
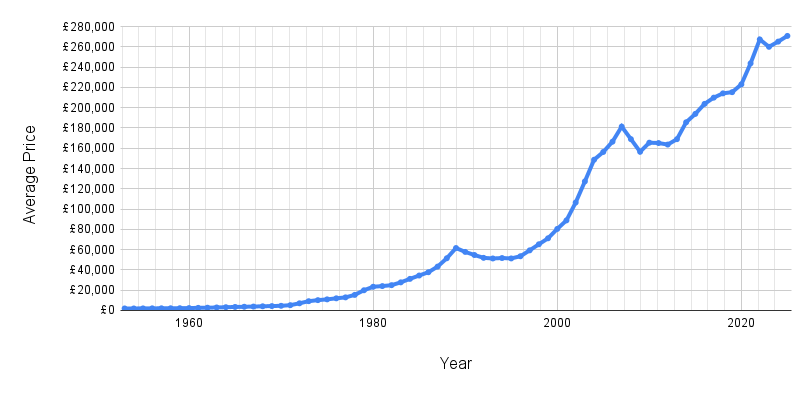
| Year | 1953 | 1954 | 1955 | 1956 | 1957 | 1958 | 1959 | 1960 | 1961 | 1962 | 1963 | 1964 | 1965 | 1966 | 1967 | 1968 | 1969 | 1970 | 1971 | 1972 | 1973 | 1974 | 1975 | 1976 | 1977 | 1978 | 1979 | 1980 | 1981 | 1982 | 1983 | 1984 | 1985 | 1986 | 1987 | 1988 | 1989 | 1990 | 1991 | 1992 | 1993 | 1994 | 1995 | 1996 | 1997 | 1998 | 1999 | 2000 | 2001 | 2002 | 2003 | 2004 | 2005 | 2006 | 2007 | 2008 | 2009 | 2010 | 2011 | 2012 | 2013 | 2014 | 2015 | 2016 | 2017 | 2018 | 2019 | 2020 | 2021 | 2022 | 2023 | 2024 | 2025 |
| Avg House Price | £1,883.75 | £1,862.80 | £1,928.00 | £1,995.52 | £2,025.79 | £2,056.06 | £2,118.93 | £2,263.30 | £2,463.55 | £2,617.23 | £2,840.77 | £3,103.89 | £3,353.04 | £3,541.64 | £3,734.91 | £4,009.67 | £4,221.57 | £4,480.03 | £5,106.39 | £6,959.88 | £9,044.57 | £10,077.66 | £10,845.61 | £11,866.37 | £12,804.84 | £15,261.40 | £19,829.94 | £23,287.58 | £23,953.54 | £24,850.98 | £27,622.98 | £31,076.12 | £34,377.71 | £37,626.64 | £43,164.24 | £51,405.05 | £61,513.78 | £57,683.31 | £54,626.02 | £51,815.19 | £51,210.66 | £51,633.31 | £51,245.26 | £53,394.00 | £59,199.25 | £65,200.71 | £71,121.81 | £80,365.71 | £88,798.97 | £106,406.75 | £127,245.85 | £148,658.31 | £156,324.64 | £166,469.58 | £181,363.56 | £168,973.40 | £156,512.49 | £165,482.84 | £165,131.02 | £163,627.76 | £168,928.12 | £185,620.05 | £193,900.03 | £203,771.32 | £209,935.27 | £214,162.85 | £215,333.37 | £223,049.71 | £243,750.12 | £267,388.28 | £259,862.03 | £265,240.00 | £270,867,00 |
*Source: Nationwide Building Society, quarterly data averaged to give approximate annual figures.
'Real' house prices over time - prices in today's money
House prices adjusted for inflation i.e. house prices in 'today's money'.
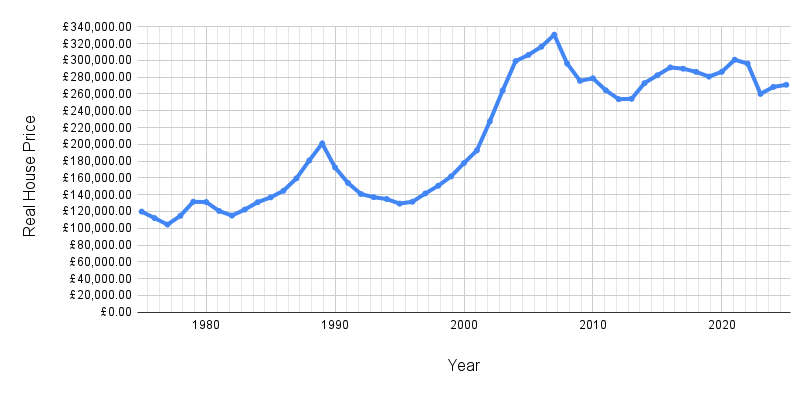
| Year | 1975 | 1976 | 1977 | 1978 | 1979 | 1980 | 1981 | 1982 | 1983 | 1984 | 1985 | 1986 | 1987 | 1988 | 1989 | 1990 | 1991 | 1992 | 1993 | 1994 | 1995 | 1996 | 1997 | 1998 | 1999 | 2000 | 2001 | 2002 | 2003 | 2004 | 2005 | 2006 | 2007 | 2008 | 2009 | 2010 | 2011 | 2012 | 2013 | 2014 | 2015 | 2016 | 2017 | 2018 | 2019 | 2020 | 2021 | 2022 | 2023 | 2024 | 2025 |
| 'Real' House Price | £119,861.17 | £112,140.86 | £104,445.02 | £114,857.37 | £131,569.28 | £131,258.19 | £120,644.86 | £115,149.42 | £122,318.58 | £131,090.70 | £136,799.27 | £144,728.44 | £159,436.96 | £180,766.38 | £200,962.00 | £172,383.30 | £154,011.88 | £140,857.16 | £137,012.50 | £134,820.40 | £129,390.63 | £131,588.50 | £141,433.14 | £150,651.52 | £161,801.86 | £177,650.80 | £192,746.19 | £227,200.51 | £264,097.42 | £299,045.11 | £306,473.18 | £316,187.96 | £330,460.06 | £296,189.72 | £275,598.86 | £278,616.95 | £264,323.05 | £253,748.83 | £254,162.34 | £272,823.50 | £282,247.75 | £291,546.55 | £290,025.90 | £286,281.65 | £280,637.94 | £286,382.51 | £300,730.92 | £296,100.14 | £259,862.03 | £265,240.00 | £270,867,00 |
*Source: Nationwide Building Society, quarterly data averaged to give approximate annual figures.
How much does the average house cost in 2025?
The average UK house price in the 1st quarter of 2025 is £270,867,00
How much did a house cost in 1990?
The average UK house price in 1990 was £57,683.31. The equivalent of £172,383.30 in today’s money.
The 90s started with falling house prices as a recession took hold. Between 1989 and 1995 average house prices fell 17%. The second half of the 90s saw a swift recovery in prices with an average house price of £71,121.81 by the end of the decade.
How much did a house cost in 1980?
The average UK house price in 1980 was £23,287.58. The equivalent of £131,258.19 in today’s money.
The 80s saw a 164% rise in house prices due to a combination of financial deregulation, economic growth, government policies and low interest rates. By 1989 the average house price had risen to £61,513.78.
How much did a house cost in 1970?
The average UK house price in 1970 was £4,480.03. The equivalent of £58,719.46 in today’s money.
The 70s saw a massive 343% rise in house prices. Eased credit conditions, economic growth, limited housing supply, government policies and low interest rates all combined to deliver a period of significant growth. By 1979 the average house price had risen to £19,829.94.
This How much did a house cost in 1960?
The average UK house price in 1960 was £2,263.30. The equivalent of £43,333.19 in today’s money.